Effective learning in the social sciences classroom can be enhanced by teaching literacy and critical thinking skills and using reasearch-based literacy strategies and other learning strategies, including cooperative learning and civic engagement. The content at the following link is a well-organized look at how to infuse teaching these skills and using these methods and strategies in the social science classroom.
https://www.doe.in.gov/sites/default/files/standards/essential-social-studies-skills-and-strategies.pdf
Other strategies for teaching social science are activity-oriented, involving mapping routes from home to school or writing poems. Read about these activities and others below.
https://www.scholastic.com/teachers/articles/teaching-content/classroom-activities-making-social-studies-come-alive-grades-6-8//
Effective learning in the social sciences classroom can be enhanced by teaching literacy and critical thinking skills and using reasearch-based literacy strategies and other learning strategies, including cooperative learning and civic engagement. The content at the following link is a well-organized look at how to infuse teaching these skills and using these methods and strategies in the social science classroom.
Primary documents, and charts, maps, and other visual materials are important tools for teaching social studies concepts. Below are some strategies for their use in the middle grades social studies classroom.
Using primary documents
Strategies for using primary documents in the classroom focus on getting students to grapple with historical events and themes using words and ideas from the past. The link below provides a basic guide to document analysis, with worksheets.
https://www.archives.gov/education/lessons/worksheets
The link below provides "case files" for your students to investigate topics ranging from "The Jamestown Starving Time" to "When Elvis Met Nixon." Click on "Investigations" and choose a file. Each includes a lesson plan with primary documents.
Political cartoons, also known as editorial cartoons, express opinions about serious subjects, and can be an important tool when teaching history, civics, geography, or economics. A political cartoonist uses people, familiar objects, and symbols to make his or her point quickly and visually. Captions and words in cartoons help to clarify their meaning. Although a cartoonist may use humor to make a point, political cartoons are not always funny.
Help your students determine exactly what the cartoonist is trying to say by having them follow the steps below.
- Look first at the title.
- What does it tell you about the topic?
- Now determine the main theme or subject of the cartoon.
- Next look at the symbols in the cartoon.
- What do they mean?
- Are any of them commonly used in the media?
- Now look at the caricatures.
- What is exaggerated?
- Who do the people in the cartoon represent?
- Identify the issues being addressed.
- Determine the cartoonist's point of view.
- What conclusions does the cartoonist want the reader to reach?
- What message does the cartoon portray?
- Is the message positive or negative? Is the point of the cartoon to motivate or change opinion?
Reading a time zone map
The concept of time zones is sometimes challenging to students, but understanding what they mean is important both in geography and in real life. A time zone map shows the 24 time zones of the world. The prime meridian runs through Greenwich, England. Each zone east of Greenwich is one hour later than the zone before. Each zone west of Greenwich is one hour earlier. The International Date Line runs through the Pacific Ocean. This is the location where each day begins. If it is Saturday to the east of the International Date Line, then it is Sunday to the west of it.
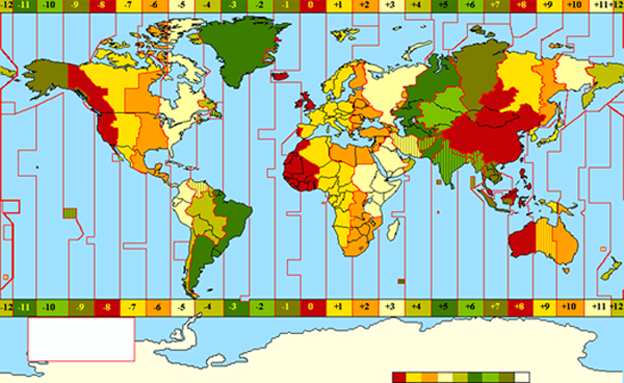
Practice: On the map above, determine the difference in hours between various time zones. For example, if you picked the orange region in Western Europe and the orange region in mid-America you would have a difference of 8 hours. Now select one time zone in Africa and one in Australia. Determine the difference in hours with your own time zone.
Reading latitude and longitude
Can your students pinpoint exactly where they are on the globe? Get your students thinking spacially by teaching them about longitude and latitude. Tell them that to locate places, geographers use a global grid system based on imaginary lines: latitude and longitude. Lines of latitude, called parallels, circle the globe. The equator circles the middle of the globe at 0°. Parallels measure the distance in degrees north and south of the equator.
Lines of longitude, called meridians, circle the globe from pole to pole. Meridians measure distance in degrees east and west of the prime meridian. The prime meridian is at 0°. It passes through Greenwich, England.
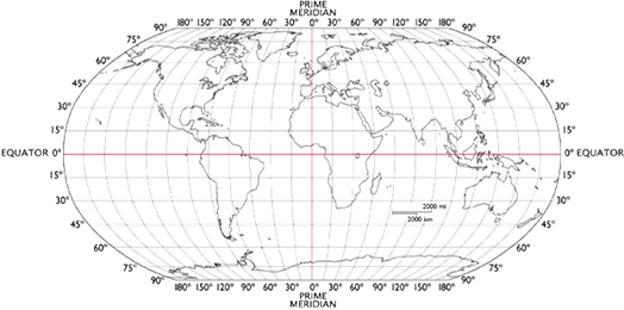
Practice: Locate Florida on the map above and approximate the latitude and longitude of any point in the state.
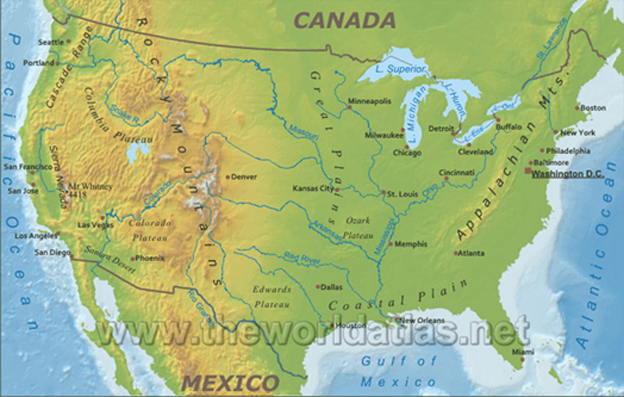
Reading a physical map
Map-reading skills are an important component of reading comprehension in the social sciences. Learning about Earth's natural diversity of landforms can be a good entry point to learning about social diversity—how do physical landforms influence the formation of various economic systems, ethnicities, and governments? Understanding physical maps also complements student understanding of political maps (see below).
Physical maps show the natural features of the Earth's surface. These include landforms such as mountains, hills and plains; and bodies of water such as rivers, lakes, bays, and oceans. Land elevation may be shown in a map key that uses color to indicate levels.
Reading a political map
Political maps show the boundaries of nations and other political areas, such as territories, colonies, and dependencies. These boundaries are delineated by lines that are usually human-made but that sometimes follow a landscape's natural features, such as rivers or other water bodies. Often political maps also show capitals and other cities.
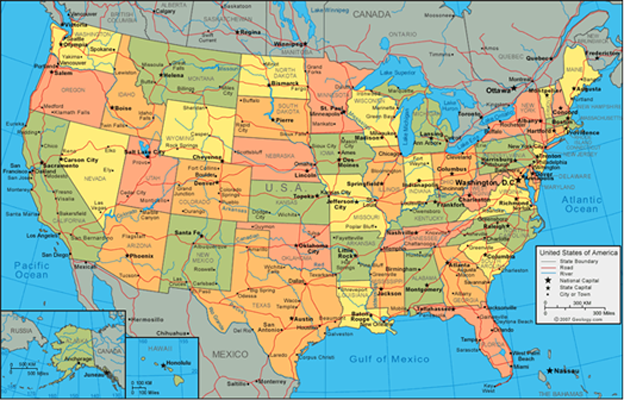
Practice: Use the map above and find the symbol used for the our nation's capital. How does this symbol differ from those used for state capitals? List two national capitals and three state capitals shown on the map.
Reading a timeline
A timeline is a visual list of dates and events shown in order in which they occurred. Timelines can be horizontal or vertical. On horizontal timelines, the earliest date is on the left. On vertical timelines, the earliest date is usually at the top.
ReadWriteThink offers Timeline, a digital tool for students to create timelines organized by day, date, or event, and add labels with text.
http://www.readwritethink.org/classroom-resources/student-interactives/timeline-30007.html
Try out the mobile Timeline app below.
http://www.readwritethink.org/classroom-resources/mobile-apps/timeline-b-31047.html
TLS Books provides a lesson and worksheet for a step-by-step guide to creating timelines.