Relating Historical Events by Cause and Effect
Graphic organizers for cause and effect
It is possible to get a better understanding of cause and effect through graphic organizers. A graphic organizer called a fishbone chart, because it looks like a fish skeleton, is one way of doing this. The largest bones attached to the ‘spine’ represent major categories of causes, while the smaller “bones” leading into the larger bones represent primary causes.
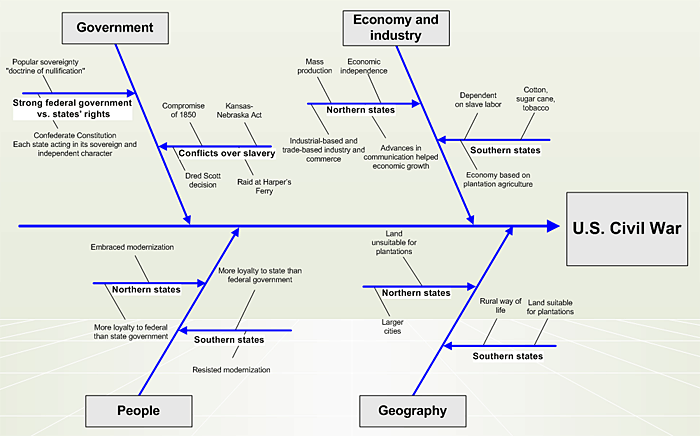
In this chart, major categories of causes include people, the government, the economy, and geography, while primary causes include northern states and southern states, among others. The ‘head’ of the fish is the main event: the Civil War.